Milk production traits in buffalo population in China
1. Overview of Buffalo Milk Production in China 2. Key Genetic Traits Influencing Milk Yield 3. Regional Variations in Buffalo Productivity 4. Factors Affecting Milk Quality and Composition 5. Breeding Strategies for High-Yield Buffaloes 6. Advances in Buffalo Genomics and Research 7. Comparative Analysis: Buffalo vs. Cow Milk 8. Challenges in Buffalo Dairy Farming in China 9. Government Policies Supporting Buffalo Breeding 10. Future Prospects of Buffalo Milk Industry in China
Abstract
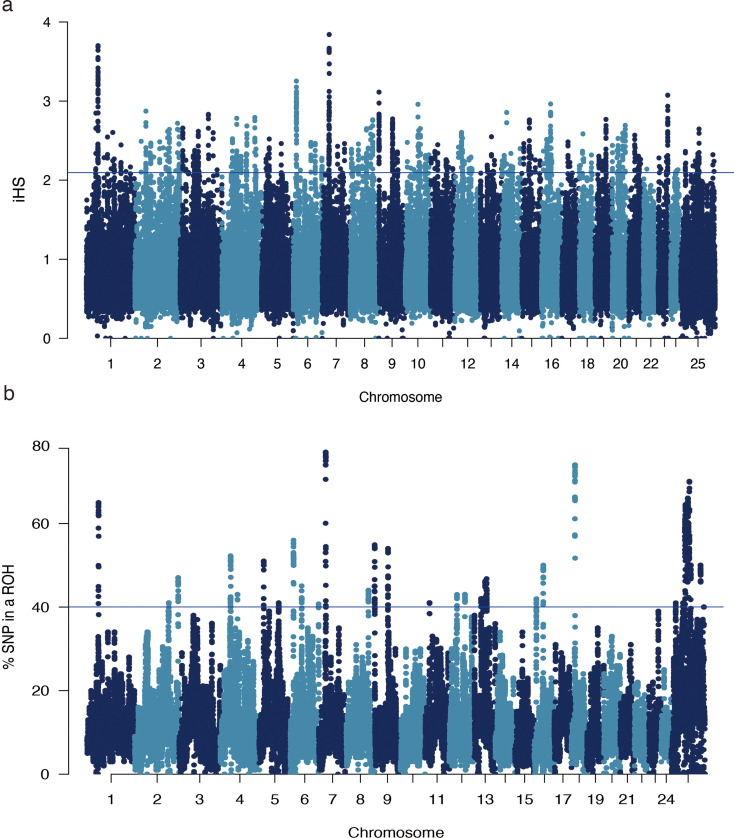
Genetic variability in livestock driven by selection leaves distinct signatures within the genome. However, the comprehensive landscape of the selection responses for milk production traits in the Chinese buffalo population remains elusive. This study employed an integrated haplotype score (iHS) and runs of homozygosity (ROH) analyses of whole-genome sequence data from 100 Chinese buffaloes to decipher selection signatures. Using iHS and ROH, we identified 1 046 and 1 045 significant genomic regions, containing 717 and 263 candidate genes, respectively. The integration of iHS and ROH revealed 258 candidate regions and 108 overlapping genes, representing true selection signatures. Additionally, 94 candidate regions overlapped with 672 previously reported quantitative trait loci associated with key economically important traits. Annotation of the genomic regions highlighted candidate genes linked to milk production traits, including SNORD42, COX18, ANKRD17, ALB, RASSF6, CXCL8, TMEM232, ARHGAP26, and NR3C1. Transcriptome-wide association analysis supported ANKRD17 and CEP41 as potential candidates for affecting milk traits. This study unveils a comprehensive selection signature profile for the Chinese buffalo population by integrating iHS and ROH methods. The findings have broad implications for improving milk production traits in buffalo populations globally, contributing to more sustainable livestock systems. The identified candidate genes shed light on the selection response for milk production traits, offering crucial insights into optimising the breeding strategies for Chinese buffaloes.
Implications
Understanding the genetic basis of milk production traits is fundamental to improving livestock performance. This study aimed to explore recent selection signatures in the Chinese buffalo population using whole-genome sequencing data and advanced analytical approaches. By identifying genomic regions under selection, the study provides a clearer understanding of the genetic factors influencing milk production. These insights can be applied to refine breeding strategies, enhance milk yield, and improve the sustainability of buffalo production systems. The methods and findings are relevant for buffalo populations globally, offering a framework for advancing genetic improvement and ensuring sustainable livestock production worldwide.
Introduction
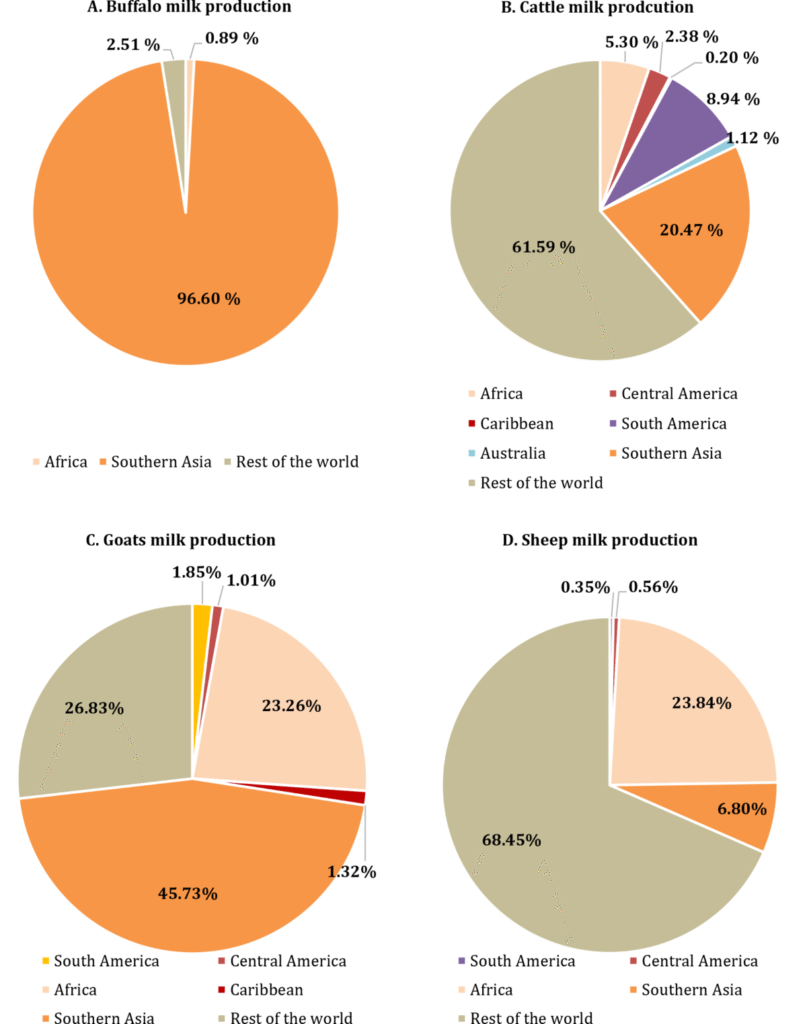
Chinese native buffalo, classified as the swamp type, is widely distributed across 18 provinces in Central and Southern China . In the 1950 s, river-type buffaloes, primarily sourced from India and Pakistan, were introduced into China for crossbreeding with indigenous buffaloes. This crossbreeding aimed to improve the productivity of the Chinese native buffalo by combining the environmental adaptability of the Chinese buffalo with the high milk yield potential of the river buffalo. The resulting crossbred buffaloes exhibited significantly higher milk yields than swamp buffaloes. For example, F1 crosses between swamp buffalo and the Murrah breed yielded an average of 1 233.3 kg milk per lactation, representing a 12.3% improvement in milk production. Similarly, a Chinese swamp buffalo crossed with Nili-Ravi demonstrated a milk yield of 2 041.2 kg per lactation, an 86.9% increase over swamp buffalo parents . Over several decades, natural and artificial selection events influenced by subtropical environments as well as intensive pasture and feedlot systems have shaped the essential economic traits of Chinese dairy buffaloes. Despite ongoing crossbreeding efforts, the milk yield of crossbred buffaloes is lower than that of the river buffaloes. The theory of population genetics suggests that functional genes subject to selection exhibit characteristic patterns known as “selective signatures” ). Investigating these selective signatures related to milk and meat production is crucial for a comprehensive understanding of economically important traits and their applications in buffalo breeding programmes.
Advancements in high-throughput and cost-effective genotyping techniques have revolutionised the identification of selection signatures. High-throughput sequencing technology, surpassing commercially available single-nucleotide polymorphism (SNP) assays, provides systematic identification of selection.
Material and methods
Animals and genotypes
A total of 100 lactating buffaloes were utilised from Guangxi Buffalo Research Institute in Guangxi, China. These buffaloes were crossbred with Murrah or Nili-Ravi buffaloes, and native Chinese buffaloes. These crossbred buffaloes comprised 62 Murrah × Chinese native buffalo crosses and 38 Nili-Ravi × Chinese native buffalo crosses. According to our previous research protocol the whole blood samples (5 mL each) were collected from the jugular vein in sterilised vacutainer tubes coated with EDTA as an anticoagulant. The samples were kept on ice and promptly transferred to the laboratory for subsequent analysis. SNP genotyping was performed on each sample using whole-genome resequencing technology implemented in the Genome Analysis toolkit v4.2 on the Illumina HiSeq 2500 platform. The Indian Murrah genome (assembly version NDDB_SH_1) was used as a reference genome. SNP filtering was conducted based on specific criteria, including QD < 5.0, QUAL < 30.0, SOR > 2.5, FS > 12, MQ < 50.0, MQRankSum < −12.5, ReadPosRankSum < −5.0, and a mean sequence depth exceeding 5× for all individuals. Subsequently, filtered SNPs were imputed using the Beagle 5.4 software ). Postimputation, a total of 100 buffaloes and 8 784 760 SNPs successfully passed the quality control measures and were used for subsequent analyses, according to our previous SNP quality control and filtering strategy.
Breed separation and genetic relationship analysis
To determine if there is breed separation among the studied population, we analysed their phylogenetic relationship, principle component analysis, and population structure. For this analysis, we additionally collected WGS data from 16 buffaloes representing eight river and eight swamp breeds. These datasets were downloaded from the NCBI SRA database with the accession numbers PRJEB39591 and PRJNA566371. These datasets were analysed using Genome Analysis toolkit v4.2 software with the same criteria mentioned above and merged with our current SNP genotyping data. This generated a dataset containing 5 963 074 SNPs from 116 buffaloes. Phylogenetic relationship, principle component analysis, and population structure analyses were then performed to assess the genetic relationship between and within the populations.
Population structure and inbreeding coefficient estimations
Genome-Wide Complex Trait Analysis (GCTA) software was used for principal component analysis to assess the structure of the Chinese buffalo population. The first three components were visualised using the ggplot2 R package. GCTA software was used to estimate the inbreeding coefficient using the −ibc command line. In this regard, three different inbreeding estimations were computed using ROH (FROH), diagonal elements of the genomic relationship matrix (FGRM), excess of homozygosity (FHOM), and correlation between uniting gametes (FUNI). The inbreeding estimates of the genomic relationship matrix were calculated using our previously described equations . The Pearson correlation coefficient between FROH and the inbreeding estimates of the genomic relationship matrix was also estimated using the cor.test function in R.
Results
Breed separation and genetic relationship
The phylogenetic relationship, principle component analysis, and population structure analyses revealed that our 100 buffalo individuals are more closely related to the river buffalo breed.
These results suggest that the genetic background of our studied buffaloes aligns more with the river buffalo, which has a chromosome number of 2n = 50. This finding is significant as it suggests that the chromosomal composition and genetic architecture of of the studied population are more likely to resemble that of the river buffalo.
Genomic regions and associated genes for the top 37 significant signals in the Chinese buffalo population.
| Chr | Start (bp) | End(bp) | No. of SNP | Mean |iHS| value | Candidate genes |
|---|---|---|---|---|---|
| 1 | 47 975 001 | 48 025 000 | 85 | 3.0231 | C1H21orf62, PAXBP1 |
| 1 | 48 175 001 | 48 225 000 | 94 | 3.2283 | EVA1C |
| 1 | 48 200 001 | 48 250 000 | 125 | 3.4178 | EVA1C |
| 1 | 48 225 001 | 48 275 000 | 166 | 3.5499 | EVA1C |
| 1 | 48 250 001 | 48 300 000 | 234 | 3.6426 | EVA1C |
| 1 | 48 275 001 | 48 325 000 | 172 | 3.5244 | EVA1C |
| 1 | 48 300 001 | 48 350 000 | 87 | 3.1013 | LOC123332713, URB1, EVA1C |
| 1 | 48 325 001 | 48 375 000 | 218 | 3.6850 | LOC123332713, URB1 |
| 1 | 48 350 001 | 48 400 000 | 258 | 3.7005 | URB1 |
| 1 | 48 375 001 | 48 425 000 | 190 | 3.3199 | MRAP, URB1 |
| 1 | 48 400 001 | 48 450 000 | 152 | 3.1167 | MRAP, MIS18A, URB1 |
| 1 | 48 425 001 | 48 475 000 | 138 | 3.2074 | MRAP, MIS18A |
| 1 | 48 450 001 | 48 500 000 | 178 | 3.3756 | MIS18A |
| 1 | 48 475 001 | 48 525 000 | 154 | 3.2024 | / |
| 1 | 48 550 001 | 48 600 000 | 86 | 3.0919 | / |
| 1 | 48 575 001 | 48 625 000 | 185 | 3.2876 | / |
| 1 | 48 600 001 | 48 650 000 | 225 | 3.3565 | / |
| 1 | 48 625 001 | 48 675 000 | 210 | 3.2671 | / |
| 1 | 48 650 001 | 48 700 000 | 229 | 3.1415 | / |
| 6 | 12 675 001 | 12 725 000 | 126 | 3.1762 | FCRL4 |
| 6 | 12 700 001 | 12 750 000 | 187 | 3.2528 | FCRL4 |
| 6 | 12 725 001 | 12 775 000 | 96 | 3.0454 | FCRL4, FCRL5 |
| 6 | 12 775 001 | 12 825 000 | 90 | 3.0860 | FCRL5 |
| 6 | 13 150 001 | 13 200 000 | 225 | 3.0316 | EMC5 |
| 6 | 13 175 001 | 13 225 000 | 236 | 3.1203 | EMC5 |
| 6 | 13 250 001 | 13 300 000 | 122 | 3.0928 | LOC123465873, LOC102393885 |
| 7 | 28 925 001 | 28 975 000 | 64 | 3.6674 | AFM, AFP, ALB |
| 7 | 28 950 001 | 29 000 000 | 72 | 3.6148 | AFP ALB |
| 7 | 28 975 001 | 29 025 000 | 45 | 3.1223 | ALB |
| 7 | 29 000 001 | 29 050 000 | 79 | 3.6490 | / |
| 7 | 29 025 001 | 29 075 000 | 85 | 3.8410 | / |
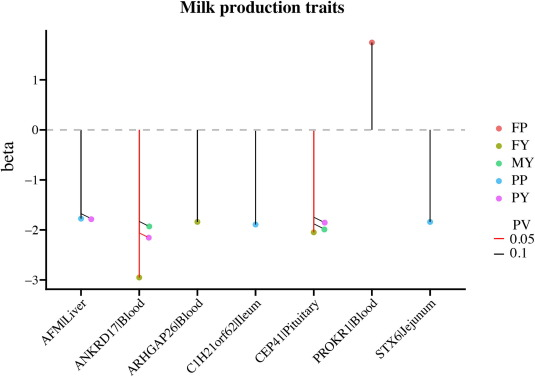
Identification of candidate genes related to milk production traits based on transcriptomics analysis
To identify potential candidate regions in buffaloes associated with milk production traits, we used TWAS results from the cGTEx database. The downloaded TWAS results contained 5 296 eGenes associated with diverse milk production traits including milk yield, fat yield, protein yield, fat percentage, and protein percentage.Our analysis detected 84 genes that overlapped with 156 candidate regions in buffalo, corresponding to the bovine genome coordinates generated by LiftOver software. Of particular interest were seven eGenes that were significantly expressed in at least one tissue and associated with milk production traits. These associations were delineated across various gene-tissue pairs. For instance, ANKRD17|Blood and CEP41|Pituitary showed suggestive significance (P < 0.1) in association with milk yield. Similarly, these gene-tissue pairs were significant (P < 0.05) in the context of fat yield. Another noteworthy finding was the suggestive significance (P < 0.1) of PROKR1|Blood concerning fat percentage. Further exploration revealed suggestive significance (P < 0.1) for the gene-tissue pairs C1H21orf62|Ileum, STX6|Jejunum, and AFM|Liver in relation to protein percentage. Specifically, for protein percentage.