ABSTRACT
Smaller scale agricultural production for food, income, and as a hobby is a growing trend among United States (US) producers. laying hens or quail are an economically viable livesock enterprise for small-scale producers with limited resources. In this study, we evaluated the economic feasibility of small-scale egg production (1,000 birds) and compared the profitability under 3 different production systems, and 2 price scenarios. The cost-benefit analysis in this study encompasses calculating and simulating all costs and returns associated with chicken and quail production over a 10-yr period. Two prices were evaluated, farm gate prices that US commercial producers, and US farmers’ market prices more often faced by small-scale producers. In all 3 production scenarios (chicken with the option of natural molting, chicken without molting, and raising quail) small-scale egg production is economically viable when farmers’ market egg prices were used to calculate the Net Present Value (NPV). Using farmers’ market prices, raising quail has the highest NPV. Raising chickens without molting has the second highest NPV, while raising chickens and allowing them to undergo molting has the lowest NPV. Contrarily, when farm gate egg prices are used in the estimation, only raising quail had a positive NPV. Although the quail enterprise resulted in the highest NPV under both price conditions, there may be marketing difficulties based on the producer’s location. Producers located near cities, or Asian populations where quail eggs are more popular may be successful with small-scale quail operations.
INTRODUCTION
The poultry industry in the United States (US) is highly diverse, spanning backyard to small-scale to large-scale commercial production. Raising chickens, quail, and other poultry on a smaller scale for food, income, and as a hobby is a growing trend among US residents. Approximately 8 million US households had chickens in 2018 with that number rapidly increasing due to COVID. While chickens remain the most common poultry among small-scale producers, other game birds, such as quail, are now being raised commercially for their meat and/or egg production. The United States Department of agriculture (USDA) census data estimated that about 736 million quail were raised in the United States in 2017. Raising quail may be a more profitable alternative to chickens due to their higher egg price and salvage meat values. However, quail housing needs differ from chickens, and the purchase price for chicks is higher. In the United States, the average purchase price for chicks is $3 per chicken, while the average price for a quail chick is $4.25 In addition, small-scale producers marketing challenges for their quail eggs and meat due to the location and population-specific nature of markets for quail products in the United States.
Potential small-scale producers often face limits when acquiring capital, land, equipment, and labor, but still have an interest in agricultural production. However, the demand for quality foods produced locally has expanded, creating market opportunities for small-scale producers. New farmers’ markets are emerging rapidly across the country, allowing small producers to reach customers directly. US government support for farmers’ markets has also increased. Farmers’ markets authorized to accept the supplemental nutrition assistant program are on the rise, increasing the low-income population’s access to locally grown and high-quality foods. The USDA also has direct programs such as the Farmers’ Market Promotion Program (FMPP), which aims to increase access to locally produced agriculture products. FMPP provides direct financial support to agricultural business and cooperatives, and producer networks under capacity building projects, and community development training and technical assistance. Through FMPP, the USDA has awarded over $58 million from 2008 to 2015 to support about 879 projects. Total funds awarded in recent years have increased significantly, with about $89.44 million awarded between 2017 and 2021.
This study evaluated production differences and compared the profitability of raising laying chickens and quail on a production scale of 1,000 birds. The cost-benefit analysis in this study encompasses calculating and simulating all costs and returns over a 10-yr period, then comparing simulated net present values (NPV). NPV is a capital budgeting technique used to discount the projected cash inflows to their present value. It is a common method of evaluating multiple alternatives because it accounts for both the time value of money and the size of the stream of cash flows over the life of the investment.
Three different egg production scenarios were compared, including 2 chicken scenarios and one quail scenario. Even within traditional chicken eggs production, producers can make different production decisions. Natural molting in chickens causes a drastic reduction in egg production, or sometimes a complete break in egg laying, which impacts producer revenue negatively. Producers can avoid the negative impact of molting if the birds are replaced more frequently, thus preventing the chickens from undergoing molting. However, replacing chickens also increases the production cost for the producer. Therefore, 2 chicken scenarios were considered, one with molting and one without molting. In all 3 scenarios, the main output is eggs with a salvage meat value after the productive life of the bird. The analysis also accounts for variability in both input and output quantity and prices, providing a range of potential financial outcomes with associated probabilities.
MATERIALS AND METHODS
The expected simulated NPV of 2 chicken scenarios, and one quail scenario for a small scale operation was estimated, including 1) raising chickens (layers) and allowing the birds to undergo molting naturally (CWM, thereafter); 2) raising chickens (layers) without molting (CNM, thereafter); 3) raising quail (Quail, thereafter). Fundamentally, the cost that the producer will incur and the corresponding benefits that will accrue from scenarios CWM and CNM are similar, with slight differences. Under the CWM scenario, the producer allows the laying birds to undergo natural molting. Thus, the birds will be replaced every 2 years over the project period. Under the CNM scenario, the producer is expected to replace the birds every year; thus, avoiding the birds’ natural molting process. Under the CWM scenario the producer has lower replacement bird expenses; but, they also have decreased revenue from lower egg production during the molting period.
Table 1. Scenarios used in analysis.
| Scenarios | Weeks of molting | Layer replacement | Age at first laying | Output |
|---|---|---|---|---|
| CWM1 | 8 weeks | Every two years | 15 weeks | Chicken eggs, salvage meat |
| CNM2 | – | Every year | 15 weeks | Chicken eggs, salvage meat |
| Quail | – | Every two years | 8 weeks | Quail eggs, salvage meat |
1 Chicken with molting.
2 Chicken without molting.
Housing
The amount of space required per bird ranges between 1.5 and 2 square feet (ft2) for larger size birds such as chickens, while quail require only 1 to 1.2 ft2. In this study, we used 2 ft2 per bird for chicken and 1 ft2 per bird for quaiL. Additionally, young birds would be kept in brooding houses for the first few weeks, requiring about 0.5 and 0.3 ft2 per bird for chicken and quail, respectively. Following these space requirements, 2 acres of land would be adequate to raise about 1,000 chickens (layers). Although quail are smaller in size, we assumed the producer will also raise 1,000 quail.
Table 2. Chicken and quail production input quantities and prices.
| Item | CWM | CNM | Quail |
|---|---|---|---|
| Housing | |||
| Space requirement for brood house (ft2 per bird) | 0.5 | 0.5 | 0.3 |
| Space requirement for main house (ft2 per bird) | 2 | 2 | 1 |
| Space unit cost ($ per ft2) | 8.82 | 8.82 | 8.82 |
| Equipment, Material, and Utility | |||
| Number of feeders in brood house | 25 | 25 | 25 |
| Number of feeders in main house | 50 | 50 | 50 |
| Number of drinkers in brood house | 25 | 25 | 25 |
| Number of feeders in main house | 50 | 50 | 50 |
| Drinker price ($ per drinker) | 20 | 20 | 20 |
| Feeder price ($ per feeder) | 20 | 20 | 20 |
| Monthly utility cost ($ per month) | 40 | 40 | 40 |
| Initial bedding materials ($) | 360 | 360 | 360 |
| Egg cooling and storage equipment ($) | 2,000 | 2,000 | 2,000 |
| Day-old-chick (DOC) | |||
| Number of DOC | 1,040 | 1,040 | 1,040 |
| DOC purchase price ($ per bird) | 3 | 3 | 4.25 |
| Mortality rate (%) | 4 | 4 | 4 |
| Feed | |||
| Amount fed- Starter feed for 0–6 wk old bird (lbs. per bird per week) | 1 | 1 | 0.8 |
| Amount fed- Grower feed for 7–15 wk old bird (lbs. per bird per week) | 1 | 1 | 0.8 |
| Amount fed- Layer feed for birds over 15 wk (lbs. per bird per week) | 1.5 | 1.5 | 1 |
| Labor | |||
| Labor (hours per wk) | 20 | 22 | 20 |
| Labor hourly cost ($ per h) | 7.25 | 7.25 | 7.25 |
1 Chicken with molting.
2 Chicken without molting.
Historical data on housing costs were collected and adjusted to reflect inflation reported $8.6 per ft2 as the housing cost for poultry prodution in 2010. We inflated this cost to 2022 values ($11.76 per ft2) using the US Bureau of Labor Statistics inflation calculator. The housing cost value by included the cost of equipment such as drinkers, feeders, and heating units in their analysis.
Equipment, Materials, Utility Requirements, and Labor
The number and cost of feeders, drinkers, and relevant egg storage equipment follows the PennState extension service recommendation, with 20 adult birds per feeder and drinker. The main housing units will require 50 drinkers and 50 feeders, while the brood houses will require about 25 drinkers and 25 feeders for each production scenario. We assumed 20% of the drinkers and feeders will be replaced every 5 yr. Additionally, a one-time cost of $2,000 for egg cooling and storage equipment was included.
This implies that the producer will practice partial house-cleanout by removing a limited amount of the old litter at the end of each year. In this analysis, we assumed the producer will remove 30% of the litter after every year, resulting in a $108 per year cost. The value of litter/manure from poultry production can range from $3.90 to $60 per ton depending on its use, location, quality, and the price of other commercial fertilizers.
Given the 4% mortality rate that is assumed in this study, 1,040 day-old-chick (DOC) were purchased to start. Because all DOC should be from hatchries certified by National Poultry Improvement Plan (NPIP), we used the average purchasing price of $3 per bird for chicken, and $4.25 per bird.
Feed Costs
Chickens and quail require different rations at various growth stages. The 0 to 6 wk old birds will be fed starter feed, while the 7 to 15 wk old birds will be given grower feed. Birds that are older than 15 wk will be given layer feed. It is recommended starter feeds contain 18 to 20% protein, grower feeds contain 15 to 16% protein, and layer feeds contain 16% protein for laying hen. The recommended protein requirements for quail are slightly higher than for chickens. In this study, we used 19% protein content for chicken starter feed and 24% for quail starter feed. The chicken grower and layer feed were set to 15 and 15.5% protein, respectively. For quail, the protein content is 18% for grower and layer feed.
Table. Chicken and quail feed formula and ingredient pricing for 2,000 lbs feed.
| Empty Cell | Chicken ration | Quail ration |
|---|---|---|
| Starter feed | ||
| Corn (lbs.) | 1,347 | 1,132 |
| Soybean meal (lbs.) | 575 | 790 |
| Calcium carbonate (lbs.) | 8 | 8 |
| Mineral mix (lbs.) | 70 | 70 |
| Grower feed | ||
| Corn (lbs.) | 1,593 | 1,250 |
| Soybean meal (lbs.) | 340 | 525 |
| Calcium carbonate (lbs.) | 7 | 165 |
| Mineral mix (lbs.) | 60 | 60 |
| Layer feed | ||
| Corn (lbs.) | 1,435 | 1,250 |
| Soybean meal (lbs.) | 345 | 525 |
| Calcium carbonate (lbs.) | 170 | 165 |
| Mineral mix (lbs.) | 50 | 60 |
| Prices | ||
| Corn ($ per lb.) | stochastic | |
| Soybean meal ($ per lb.) | stochastic | |
| Calcium carbonate ($ per lb.) | 0.78 | |
| Mineral mix ($ per lb.) | 0.81 | |
1 Starter feed is fed at 0–6 wk of age.
2 Grower feed is fed at 7–15 wk of age.
3 Layer feed is fed at greater than 15 wk of age.
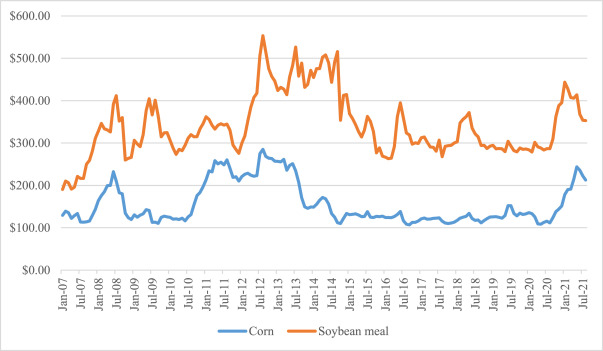
Table. Distribution of stochastic variables.
| Variables | CWM & CNM | Quail |
|---|---|---|
| Egg production (number per year per bird) | ||
| maximum | 350 | 342 |
| mean | 307 | 281 |
| minimum | 222 | 250 |
| Egg farm gate ($ per dozen) | ||
| maximum | 3.01 | 4.66 |
| mean | 1.86 | 2.45 |
| minimum | 1.17 | 1.35 |
| Farmers’ market egg price ($ per dozen) | ||
| maximum | 4.52 | 7.76 |
| mean | 2.79 | 4.09 |
| minimum | 1.75 | 2.26 |
| Corn price ($ per lb.) | ||
| maximum | 0.14 | |
| mean | 0.08 | |
| minimum | 0.05 | |
| Soybean meal price ($ per lb.) | ||
| maximum | 0.28 | |
| mean | 0.17 | |
| minimum | 0.10 |
1 Chicken with molting.
2 Chicken without molting.
Weekly Egg Production
Egg production each week is based on the assumption that the producer will select the breed of bird that is most efficient in converting feed into eggs under their management system. Common breeds that are excellent layers available on the market for small scale producers are leghorns, sex-links. Their egg production ranges between 250 and 320 eggs per year. Since the number of eggs produced per year varies across breeds and other factors, we collected data reported in the literature and from poultry websites. Again, a triangular distribution was used for egg production with a minimum of 222, a mean of 307, and a maximum of 350 eggs per yr per bird. The quail simulation assumed a triangular distribution for egg production with a minimum of 250, a mean of 281, and a maximum of 342 eggs per wk per bird.
This simulation lasts for ten years (520 wk). In both the CWM, and CNM scenarios, chickens begin laying eggs at 15 wk old, while quail begin laying eggs at 8 wk old under Quail scenario. At the beginning of year one, there is a period when eggs will not be produced for all scenarios. In subsequent years, we assumed the producer would be able to time the rearing of new chicks with the culling of spent eggs, resulting in no gap in production. In the CWM scenario, hens will undergo molting 5 times over the 10-yr simulation. During the molting period, we made the conservative assumption that the birds would produce zero eggs for 8 wk.
Meat Salvage Values
The second stream of revenue considered in the analysis is the sale of salvage meat. Meat from salvage hens at the end of their productive life usually has low market value. reported that, compared to broiler chicken, spent layers have lower carcass and portion weights resulting in a lower market value. We assumed a moderate price of $1.50 per spent chicken as reported by. Meat from quail at the end of egg production generally has a higher market value. The salvage value for quail was set at $3.00 per bird.
Economic Model
The financial comparison of the 3 scenarios is based on the expected net present value (NPV). For each scenario, the cost component consists of the fixed costs and the variable costs. The main fixed cost components considered include housing, equipment (feeders and drinkers), interest charges, and cost of egg cooling equipment. The variable cost for the producer includes the cost of DOC, feed, utility, bedding material, and labor. Because the amount of land used is constant across the 3 scenarios, the cost of land is not included in this analysis. Depending on the current price of land in any given area, a producer may not generate enough income from these scenarios to make a profit. Therefore, the NPV includes all costs other than land.
RESULTS
It presents the results from our analysis when farm gate prices are used. In the CWM, the mean NPV is negative $58,330 and has a standard deviation of $3,449. The probability of a positive NPV is 0%. Similarly, in the CNM scenario, the mean NPV is negative $51,476 and has standard deviation of $3,566. The probability of a positive NPV is 0%. In the third scenario where the producer raises quail and accepts farm gate prices, the simulated mean NPV is positive $109,389 and has a standard deviation of $5,036. The probability of a positive NPV for the quail scenario is 100%. Using the farm gate prices, the quail scenario is the only option with a positive mean NPV.
Table. Simulated Net Present Value (NPV) under different scenarios and egg prices over 10 yr.
| Empty Cell | NPV | Probability of a positive NPV | |||
|---|---|---|---|---|---|
| Mean | Maximum | Minimum | Standard deviation | ||
| Sell eggs at farm gate price | |||||
| CWM | −$58,330 | −$42,068 | −$72,406 | $3,449 | 0% |
| CNM | −$51,476 | −$37,195 | −$67,505 | $3,566 | 0% |
| Quail | $109,389 | $129,849 | $89,504 | $5,036 | 100% |
| Sell eggs at farmers market price | |||||
| CWM | $188,843 | $207,407 | $170,747 | $4,645 | 100% |
| CNM | $216,436 | $236,806 | $194,871 | $4,850 | 100% |
| Quail | $327, 893 | $368,036 | $291,787 | $8,330 | 100% |
1 Chicken with molting
2 Chicken without molting.
Simulated mean NPVs using the farmers’ market price data were positive in all scenarios. In the CWM scenario, the mean NPV is positive $188,843 and has standard deviation of $4,645. The probability of a positive NPV is 100%. Similarly, in the CNM scenario, the mean NPV is positive $216,436 and has standard deviation of $4,850. The probability of a positive NPV is 100%.
DISCUSSION
In general, small-scale production of both chickens with and without molting is unprofitable if the producer must sell at commercial/farm gate. This is because small-scale producers do not benefit from economies of scale like large-scale industrialized producers. Quail production on the other hand is economically viable based on simulated positive NPVs even when the producer must sell at commercial/farm gate prices.
Despite the positive mean NPVs in all scenarios when farmers’ market prices are used in the analysis, raising quail has the highest NPV compared to raising chickens. Similarly, raising chickens and replacing the birds frequently (no molting) has higher mean NPVs than raising chickens and allowing the birds to naturally undergo molting. Thus, raising quail is expected to be a more profitable venture than raising chickens. However, the percentage of small-scale producers that raise chickens is higher than raising quail. As noted by, small scale quail producers need to acquire new and/or necessary production and marketing skills for quail production. Comparatively, many small-scale producers may already have the necessary skill to raise chickens as well as increased availability of resource materials on chicken production.
In comparing the chicken production options only, allowing the hens to undergo natural molting is less profitable compared to raising chickens without molting. The additional costs associated with raising chickens with no molting are the cost of purchasing day-old-chicks and the extra cost of labor associated with raising additional chicks. In our estimation, over the 10-yr period, the option of replacing the chickens every year instead of replacing them after 2 yr, will cost an additional $15,600, and result in additional labor costs of $7,540.
Throughout the analysis, it is apparent that the price at which the small-scale producer can sell their eggs is critical in determining the viability of the enterprise. For example, for both chicken scenarios, the mean NPVs only became positive when farmers’ market prices were used in the analysis. Whereas farmers’ market prices present enormous opportunity to the farmers, it is not without challenges. First, farmers’ markets are only in a few locations. Thus, depending on the location of the farm, the producer might incur additional cost (labor and/or transportation) which can reduce the NPV of the project. Second, some farmers’ markets also require expensive licensing, and have fees for selling. All these factors can result in a lower NPV based on individual circumstances.
Additionally, for the quail enterprise, depending on consumer preferences near the producer it may be difficult to sell all of the eggs and spent birds produced. It was also assumed that quail farm gate prices and farmers’ market prices were similar. If commercial quail production were to increase, farm gate prices would likely decrease. However, based on previous literature, there would likely still be a premium for farmers’ market quail eggs. Another important note is that the market for quail eggs is likely to be less stable than for chicken eggs. Chicken eggs are a commonly consumed and popular product in the United States. It is unclear what future demand for quail eggs will be.