Nutritional quality of buffalo and camel milk
1. Introduction to Buffalo and Camel Milk 2. Comparative Nutritional Profile 3. Fat Content and Health Implications 4. Protein and Amino Acid Composition 5. Vitamins and Mineral Richness 6. Lactose Levels and Digestibility 7. Health Benefits of Camel Milk 8. Medicinal and Traditional Uses 9. Suitability for Special Diets 10. Conclusion: Choosing the Right Milk for You

Summary of nutritional quality of buffalo and camel milk:
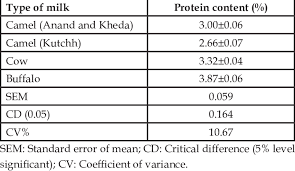
- Buffalo milk is high in fat (6–8%) and protein, making it rich and energy-dense.
- It contains more calcium and phosphorus than cow’s milk, supporting bone health.
- Buffalo milk is also rich in Vitamin A and B-complex vitamins.
- Due to its high lactose, it may not suit lactose-intolerant individuals.
- Camel milk has lower fat (~3–4%) but is rich in healthy unsaturated fats.
- It’s easier to digest due to lower lactose content.
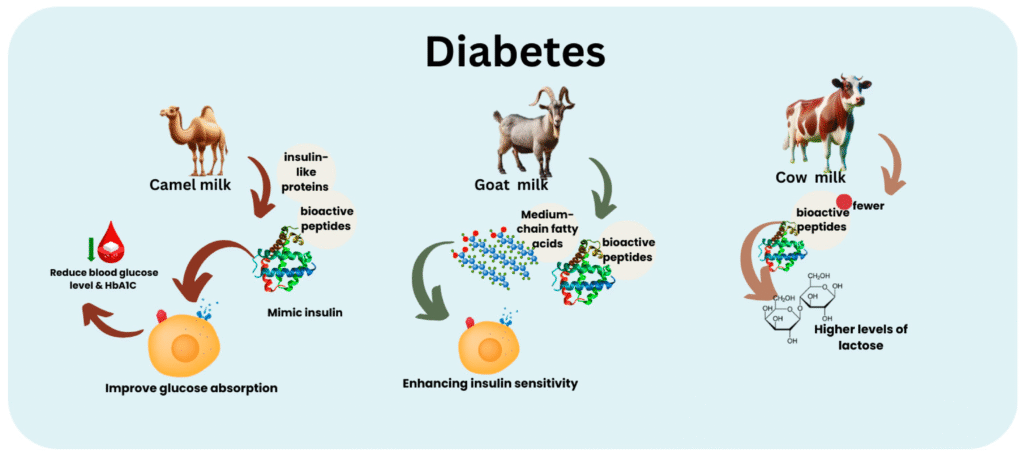
- Camel milk contains 3–5 times more Vitamin C than cow or buffalo milk.
- It also offers iron, zinc, and antioxidant proteins like lactoferrin.
- Studies suggest camel milk may benefit those with diabetes or autoimmune issues.
- Both types offer unique nutritional advantages, especially in traditional diets.
Key words
Buffalo milk Camel milk
Fatty acidomics Seasonal variations
ABSTRACT
Interest in nonbovine milk, such as buffalo and camel milk, for human consumption is increasing, yet information on their nutritional quality is limited. This study aimed to investigate the fatty acid profiles of camel and buffalo milk, focusing on how species and seasonal variations affect their nutritional value. Buffalo milk and camel milk samples were collected respectively from the Guangxi Zhuang Autonomous Region and Xinjiang Uyghur Autonomous Region of China over the year. A total of 88 fatty acids (C1–C24) were quantified using GC-MS as part of a comprehensive fatty acidomics approach. The results showed that species differences had a greater impact on fatty acid profiles than seasonal variations. Buffalo milk had higher concentrations of short-chain fatty acids, especially C4:0, whereas camel milk was richer in UFA. In autumn and winter, both milks had higher levels of even-chain SFA and UFA (n-1, n-3, n-5, n-6, n-7, n-12). Conversely, milk in spring and summer had higher levels of n-9 UFA, even- and branch-chain SFA. Camel milk showed more favorable fatty acid characteristics, including an optimal n-6/n-3 PUFA ratio for reducing inflammation and cardiovascular risks. In autumn, both milks had higher n-6/n-3 PUFA ratios, PUFA/SFA ratios, and health.
INTRODUCTION
In recent years, nonbovine milk alternatives have garnered growing global interest due to their unique nutritional profiles . Although cow milk has long been dominant in the dairy market buffalo and camel milk have gained recognition for their distinct health benefits and ability to meet diverse consumer health needs. Despite increasing consumer interest, comprehensive research on the nutritional quality and variability of these milks remains limited. Therefore, studying their nutritional composition and understanding the factors that influence their quality is crucial for enhancing their value in the global dairy market.
In China, Xinjiang Uyghur Autonomous Region is the leading area for camel milk production, whereas Guangxi Zhuang Autonomous Region is the primary area for buffalo milk, with both regions contributing the largest share of the country’s total output. Although some studies have examined the nutritional properties of these milks there are significant gaps in research comparing their FA profiles and seasonal variations. Most studies focus on major FA, particularly those constituting more than 1% of the total fat content, whereas minor FA—such as short-chain fatty acids (SCFA), odd- and branched-chain fatty acids (OBCFA), and UFA beyond n-3, n-6, and n-9—have received limited attention. Furthermore, these studies often focus on FA within the C4 to C24 range, neglecting a comprehensive profile of all FA from C1 to C24 in milk.
MATERIALS AND METHODS
Sample Collection
Fresh milk samples from buffalo and camel were consecutively collected from multiple ranches in the Guangxi Zhuang Autonomous Region and Xinjiang Uyghur Autonomous Region of China between April 2023 and January 2024. The samples were gathered seasonally: camel milk in May (n = 15) and buffalo milk in April (n = 12) for spring; camel milk in July (n = 7) and buffalo milk in August (n = 10) for summer; camel milk in September (n = 9) and buffalo milk in October (n = 8) for autumn; and camel milk in December (n = 18) and buffalo milk in January (n = 11) for winter. All milk samples were collected from milk tanks, which represent pooled milk from multiple lactating animals at each ranch. After collection, the samples were frozen at −20°C for temporary storage before being transported to the laboratory. Upon arrival, they were stored at −80°C until analysis of their FA profiles.
Chemicals and Regents
Methanol, isopropanol, and n-hexane (all MS grade), along with sodium hydroxide (purity ≥ 99%), were sourced from Merck (Darmstadt, Germany). Acetyl chloride (purity > 99.5%) and hydrochloric acid (purity ≥ 98%) were obtained from Macklin Co. Ltd. (Shanghai, China). Ultrapure water was produced using a Milli-Q purification system (Millipore, Bedford, MA). Standards for triglycerides, FA, and FA methyl esters were acquired from various suppliers, including Nu-Chek Prep Inc. (Elysian, MN), Anpel (Shanghai, China), Larodan (Malmo, Sweden), AccuStandard (New Haven, CT), Merck (Darmstadt, Germany), and Dr. Ehrenstorfer (Augsburg, Germany).
Milk composition
FA Analysis
Fatty acid in milk were converted into corresponding FA esters and determined by GC-MS, following methods described in previous studies ; Zhang, 2024). Two milk aliquots were subjected to separate derivatization processes: isopropyl esterification for SCFA (C1–C6) and methyl esterification for medium- and long-chain fatty acids (MLCFA, C7–C24).
The isopropyl esterification method for SCFA was adapted from . Briefly, 1 mL of milk was mixed with 3 mL of a n-hexane/isopropanol solution (1:2, vol/vol). After thorough mixing and centrifugation, the upper organic layer was transferred to a heat-resistant glass tube. Then, 2 mL of a 2% sodium hydroxide isopropanol solution was added, and the sealed tube was heated in a 50°C water bath for 30 min. After cooling, 2 mL of a 10% hydrochloric acid isopropanol solution was added, and the mixture was heated at 80°C for 150 min. After cooling again, 10 mL of saturated sodium chloride solution was added, and the upper organic phase was collected and diluted with n-hexane to volume. The FA isopropyl esters were transferred to a new vial for further analysis. For analysis, the FA isopropyl esters were examined using an Agilent 7890A GC (Agilent Technologies, Santa Clara, CA) equipped with a 7000 B MS detector system. Separation was achieved with an Agilent DB-1 capillary column (30 m × 0.25 mm × 0.20 µm), and FA (C1–C6) were detected using selected ion monitoring mode.
The methyl esterification method for MLCFA was adapted from In this procedure, 2 mL of milk was mixed with 4 mL of a n-hexane/isopropanol solution (3:2, vol/vol). After mixing and centrifugation, the upper organic phase was transferred to a heat-resistant glass tube. Then, 2 mL of a 2% sodium hydroxide solution in methanol was added and heated at 50°C for 20 min. Next, 2 mL of a 10% acetyl chloride solution in methanol was added, and the mixture was heated at 90°C for 150 min. After cooling, 10 mL of saturated sodium chloride solution was added, and the upper organic phase was collected and diluted with n-hexane to volume. The FA methyl esters were transferred to a new sample vial for analysis. The FA methyl esters were analyzed using the same GC-MS system, employing a 100 m × 0.25 mm × 0.20 µm CP-Sil 88 capillary column (Agilent Technologies, Santa Clara, CA).
Lipid Nutritional Quality Indices
Lipid Nutritional Quality Indices are important measures used to evaluate the health impact of fats in food, especially in milk and meat. These indices include the Atherogenic Index (AI), Thrombogenic Index (TI), and the hypocholesterolemic/hypercholesterolemic (h/H) ratio. A lower AI and TI indicate a lower risk of heart disease, while a higher h/H ratio suggests better cholesterol-lowering potential. These indices help assess whether the fat composition in foods promotes or reduces cardiovascular risk, making them valuable tools in nutritional and dietary studies.
RESULTS AND DISCUSSION
Whole FA Profiles of Camel and Buffalo Milk
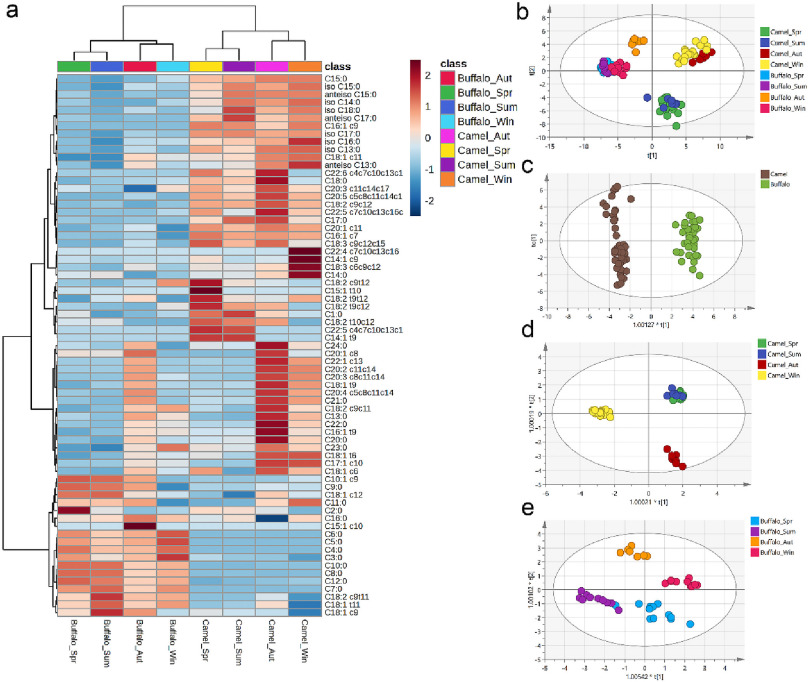
The distribution of whole FA (C1–C24) in camel and buffalo milk across the 4 seasons—spring, summer, autumn, and winter—was investigated. A heatmap of the relative abundance of 88 FA revealed a distinct clustering of samples within each species across different seasons; however, there was a clear differentiation between the 2 species. The score plot of PCA further demonstrated that the compositional differences in FA between buffalo and camel milk were significantly more pronounced than seasonal variations, with inconsistent changes observed in buffalo and camel milk across different seasons.
The physiological adaptations of buffalo and camel to their respective environments also influence their milk fat metabolism. As a desert-adapted species, camels adjust their metabolism during arid seasons to conserve energy, resulting in an increased proportion of LCSFA, such as C18:0, in their milk. This may be linked to their ability to withstand dehydration and their energy storage needs. Conversely, buffaloes, which are less cold-tolerant, may increase the proportion of C18:1 cis-11 (UFA with better antifreeze properties) in their milk during winter to maintain milk fat fluidity. They also mobilise body fat, leading to an increase in the C18:0 proportion ..
Our findings provide compelling evidence of the distinct FA compositions in buffalo and camel milk, contributing valuable insights into the functional benefits of dairy products. These differences offer opportunities for further research on milk-based products and their nutritional properties, paving the way for more tailored dietary recommendations based on the unique profiles of different milk types.
Seasonal Variations in FA Profiles
This study investigates seasonal variations in the FA profiles of camel and buffalo milk using OPLS-DA. The score plots for camel milk and buffalo milk reveal distinct seasonal clustering. Notably, camel milk from spring and summer shows no significant differences, whereas it is clearly differentiated from milk collected in autumn and winter. In contrast, buffalo milk demonstrates significant variation across all 4 seasons, indicating that seasonal changes affect the FA compositions of both types of milk.
Our analysis identified 56 FA in camel milk with significant seasonal differences (Supplemental Table S3, see Notes). The VIP scores highlighted 12 FA with VIP values greater than 1 among camel milk across seasons (Supplemental Figure S3, see Notes). Using VIP values above 1 and P-values below 0.05, we confirmed significant seasonal variations in these FA. Specifically, C1:0 was significantly higher in spring and summer camel milk compared with other seasons, whereas anteiso C15:0 had a lower proportion in spring. Additionally, C16:0 and C16:1 cis-9 were notably reduced in autumn, and anteiso C17:0 was significantly lower in both spring and autumn. In contrast, C18:0 was higher in autumn, whereas C18:1 cis-6 was significantly lower in summer. C18:1 cis-9 showed a marked decrease in winter, and C14:0 increased during this season, whereas C17:0 cis-10 was absent in spring and summer but present in autumn and winter. C18:1 cis-11 was significantly higher in autumn, and C18:3 cis-9,cis-12,cis-15 was notably lower in winter. Similar seasonal trends in camel milk have been reported in other regions with different husbandry practices; for example, camel milk from East Africa exhibited minor variations in SFA during the rainy season, with an increase in C18:1 cis-9 correlated with winter rains that enhance fresh grass growth.
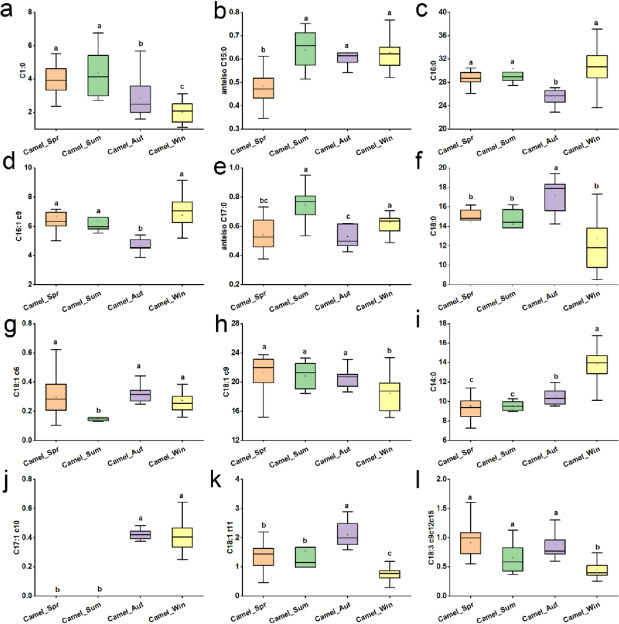
Seasonal variations in fatty acid profiles of came milk. Bar plot of significantly different fatty acids, C1:0 (a), anteiso C15:0 (b), C16:0 (c), C16:1 cis-9 (d), anteiso C17:0 (e), C18:0 (f), C18:1 cis-6 (g), C18:1 cis-9 (h), C14:0 (i), C17:1 cis-10 (j), C18:1 trans-11 (k), C18:3 cis-9,cis-12,cis-15 (l). The figure shows 12 different fatty acids of buffalo milk and camel milk, where the P < 0.05, and the VIP value is >1. The box chart shows the upper and lower quartiles, 1.5 quartile spacing, median, and mean.
In buffalo milk, our analysis revealed 52 FA with significant seasonal differences (Supplemental Table S4, see Notes). The VIP scores pinpointed 9 key FA with VIP values exceeding 1 among buffalo milk across seasons (Supplemental Figure S4, see Notes). Applying the same criteria (VIP > 1 and P < 0.05), we identified 9 FA that displayed significant seasonal variation. Specifically, C1:0 was higher in spring and winter buffalo milk, whereas C12:0 levels increased in spring. C4:0 was elevated in spring and winter, and C6:0 was significantly lower in summer. C10:0 was notably higher in spring and summer, and C12:0 and C14:0 were significantly lower in autumn. C18:1 cis-9 decreased markedly in winter, whereas C18:1 cis-11 was significantly higher in autumn and winter. These seasonal patterns have also been documented in buffalo milk from various countries; for instance, in the United States, levels of SFA were lower in buffalo milk from April to July and in Pakistan, SFA (C6:0–C16:0) were higher in winter and spring, whereas UFA such as C18:1 cis-9 were more prevalent in autumn.